

Microsoft Power BI is a business intelligence tool that helps users connect, analyze and visualize data from multiple sources. It enables organizations to create interactive reports and dashboards for monitoring performance and making data-driven decisions.
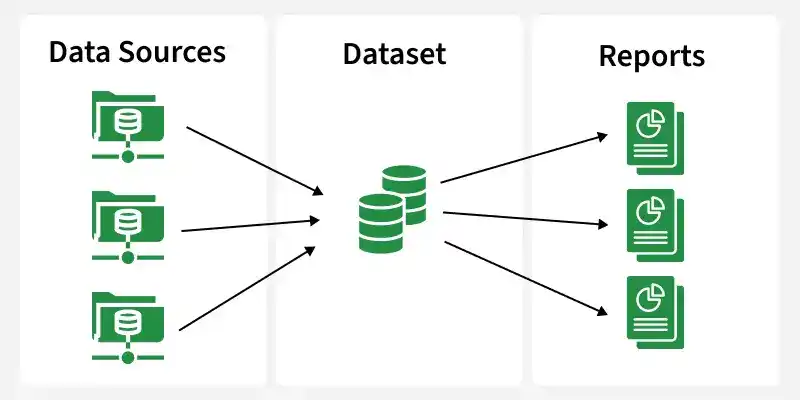
Applications
1. Data Visualization
- Combines data from multiple sources into interactive reports and dashboards.
- Uses charts, graphs and KPIs to highlight important trends and metrics.
2. Performance Monitoring
- Tracks business metrics, project progress and operational performance.
- Helps teams monitor current data and identify issues quickly.
3. Sales Analysis
- Identifies top-performing products, categories and regions.
- Analyzes sales trends and customer buying patterns.
4. Marketing Analysis
- Evaluates campaign performance, engagement and conversions.
- Helps identify effective marketing strategies using data.
5. Financial Analysis
- Tracks revenue, expenses, profits and other financial metrics.
- Helps identify cost trends and support budgeting decisions.
6. Product Analysis
- Compares product performance and profitability.
- Helps organizations identify products that need improvement or further investment.
Practical Example: Financial Analysis in Power BI
Let's use the Financials sample dataset to create visuals that demonstrate how Power BI can be used to analyze sales and profit data.
Loading the Financials Sample
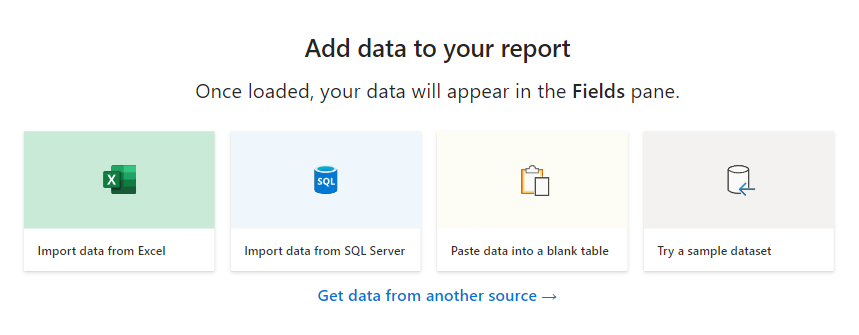
- Open Power BI Desktop and select Learn with sample data from the Home page. Choose Load sample data and select the Financials sample.
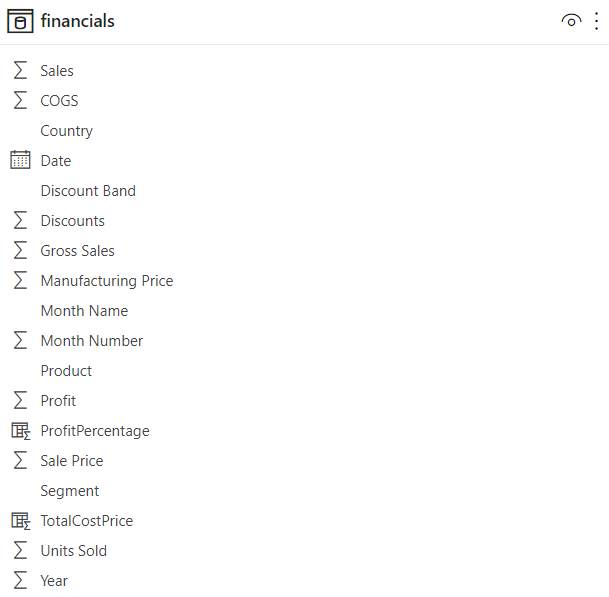
- The Financials dataset contains sales and profit information organized by products, segments and countries/regions, making it suitable for demonstrating basic financial analysis in Power BI.
The dataset gives insights into the Sales and Profits of certain products belonging to different segments in multiple countries over 2013-14. It comprises the following columns by default:
Step 1: First, navigate to the Data Tab and select the Table Tools options from the top navigation bar. Select the New Column option from the table tools and opportunities to create a new custom column.

Step 2: On clicking the New Column option, an input bar will appear where we will write a simple DAX expression to create our columns.


Step 3: In DAX, we can access a particular column using the following syntax - tableName[columnName],The following DAX Expression creates a new column named TotalManufacturingPrice.
TotalManufacturingPrice = financials[Manufacturing Price]*financials[Units Sold]

Step 4: Now, using this newly created column, we make our ProfitPercentage column using the below expression.
ProfitPercentage = (financials[Profit]/financials[TotalManufacturingPrice])*100

Step 5: Now, Select the Line chart from the Visualization. Drag the segment and drop to the X-axis, Again drag the ProfitPercent and drop to the Y-axis that we have created our custom columns, we can use a line chart which comes out to be like this:

Profit Analysis Using a Donut Chart
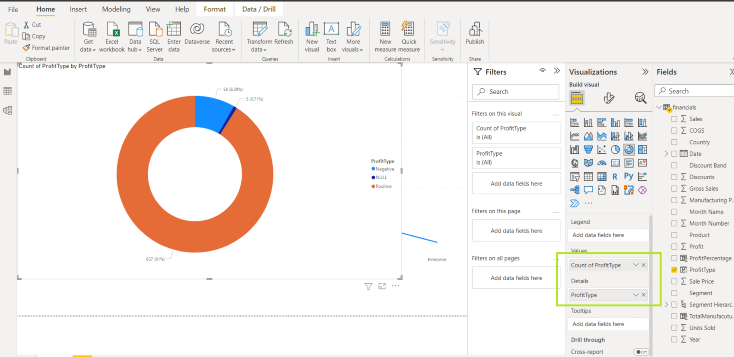
Step1: Power BI can also categorize records based on their profit values. Create a calculated column using the SWITCH function:
ProfitType = IF(financials[Profit] < 0, "Negative", IF(financials[Profit] > 0, "Positive", "NULL"))
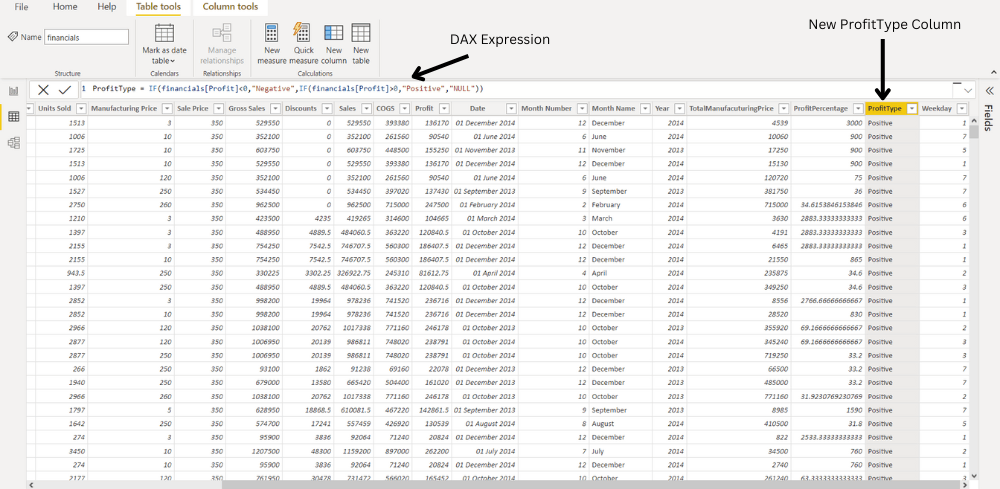
Step 2: Select a Donut chart and add ProfitType to the category/legend field and a suitable field to Values. The resulting chart shows the distribution of positive, negative and zero-profit records.
Analysis of most profitable day using Bar Chart in Power BI
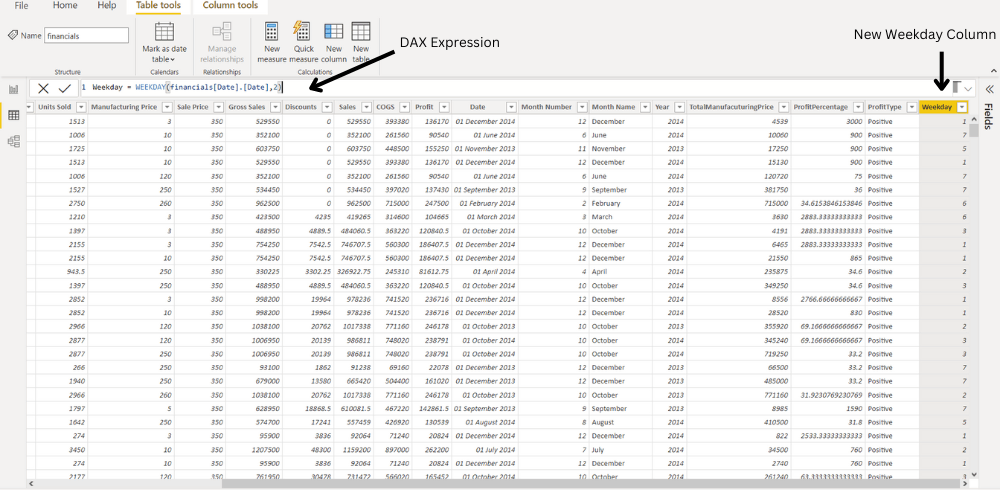
Suppose we also want to analyze which day of the week has the most significant number of sales or profit; so for this, we can create an additional column, Weekday, by extracting the day of the week from the Date Column already provided using the DAX WEEKDAY function like this:
Weekday = WEEKDAY(financials[Date].[Date],2)
Here, the second parameter of the function refers to the return type.
- If return type = 1, week begins on Sunday (1) and ends on Saturday (7). numbered 1 through 7.
- If Return type = 2, week begins on Monday (1) and ends on Sunday (7).
- If Return type = 3, week begins on Monday (0) and ends on Sunday (6).numbered 0 through 6.
For the above function return type is 2, i.e the week begins on Monday.
Step 1: On clicking the New Column option, an input bar will appear where we will write a simple DAX expression to create our columns.
Step 2: Using this custom column, we can plot the following bar chart and conclude that we get Maximum Profits on Tuesdays (Weekday = 2)

