

The saving curve is derived from the consumption curve by using the relationship between income, consumption, and saving.
The fundamental equation is:
\boxed{S = Y - C} Where:
- S = Saving
- Y = Income
- C = Consumption
So, saving is the part of income that is not spent on consumption.
As we know that Y = C + S, which means that as consumption and savings together make up income, the consumption curve and saving curve are complementary curves. Therefore, it is possible to derive the saving curve from the consumption curve and the consumption curve from the saving curve. Let us derive the saving curve from the consumption curve.
For this, first of all, draw a consumption curve CC with OC as autonomous consumption and a 45° line OY representing the income curve as shown in the below graph.
- The point where the consumption curve CC and income curve OY intersect is the break-even point, i.e., Point E.
- At this point consumption is equal to income, and average propensity to consume is one.
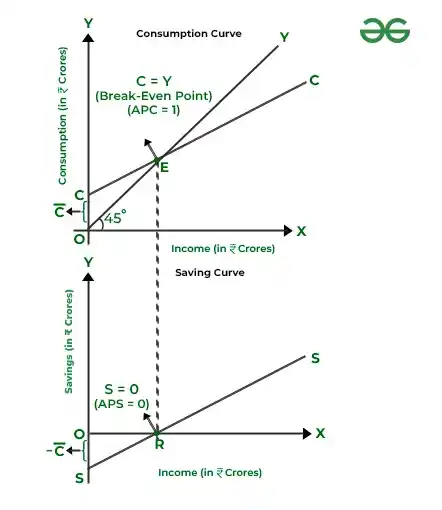
At zero income level, OC is the autonomous consumption
Similarly, we can also derive consumption curve from saving curve. The starting point of the consumption curve on the Y-axis will be equal to dissaving at zero income level and the second point on the consumption curve will be the point perpendicular from the point where the saving curve intersects the X-axis.
