HELM is a package manager for Kubernetes that simplifies the process of installing, configuring, upgrading, and managing applications on a Kubernetes cluster. It uses packages called Charts, which contain all the necessary Kubernetes configuration files needed to deploy an application.
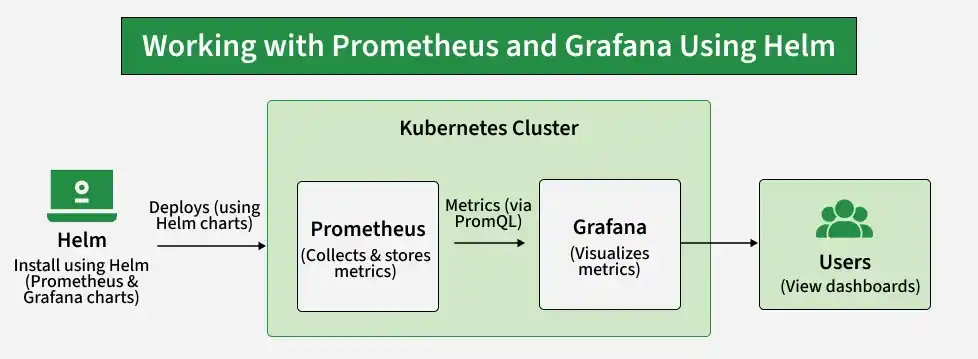
Prometheus
Prometheus is an open-source monitoring and alerting tool used to collect, store, query, and analyze metrics from applications, servers, and services. It is especially useful in cloud-native environments like Kubernetes.
- Collects metrics such as CPU usage, memory usage, request rate, and response time to monitor the health and performance of applications and servers.
- Can monitor Kubernetes clusters, nodes, pods, containers, and applications.
- Uses PromQL (Prometheus Query Language) to query and analyze collected metrics.
- Works with Alertmanager to send alerts and integrates with tools like Grafana for visualization and PagerDuty/Slack/Email for notifications.
- Prometheus is free, open-source, and can work independently or with other monitoring too
Prometheus Architecture
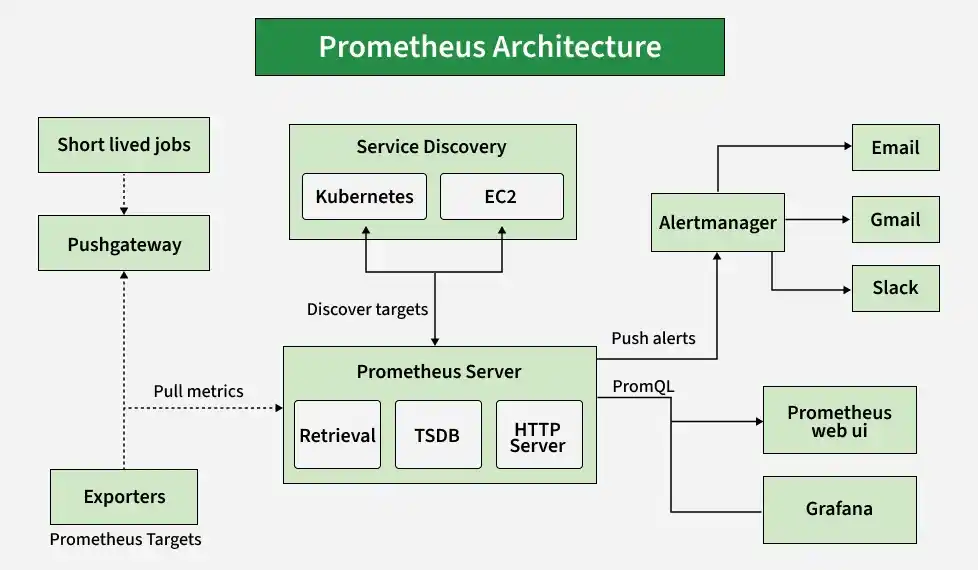
Prometheus is a monitoring system that consists of the following components:
- A main server that scrapes and stores time series data
- A query language called PromQL is used to retrieve and analyze the data
- A set of exporters that are used to collect metrics from various systems and applications
- A set of alerting rules that can trigger notifications based on the data
- An alert manager that handles the routing and suppression of alerts
Prometheus Server
- Data Storage: Prometheus stores collected metrics in a time-series database (TSDB), where data is stored with timestamps.
- Web Interface & PromQL: It provides a web interface where you can use PromQL to query and analyze metrics.
- Dashboards: You can create dashboards to visualize monitoring data.
- Alerting: Prometheus uses alerting rules to detect problems and sends alerts through Alertmanager.
- Flexible Architecture: Its modular design allows it to work with different tools like Grafana and other notification systems.
Grafana
Grafana is an open-source monitoring and visualization tool used to create dashboards and display data and metrics in an easy-to-understand way. It is commonly used with Prometheus to visualize time-series data.
- Displays metrics using graphs, charts, gauges, and tables.
- Allows you to create and customize dashboards according to your needs.
- Supports many data sources such as Prometheus, Elasticsearch, and InfluxDB.
- Can create alerts and send notifications when specific conditions are met.
- Supports plugins and integrations with tools like Slack and PagerDuty.
Why Prometheus and Grafana?
- Prometheus and Grafana are commonly used together for monitoring and visualization.
- Prometheus collects and stores metrics from applications, servers, and Kubernetes, while Grafana uses this data to create easy-to-understand dashboards, graphs, and charts.
- Grafana can use PromQL to query data from Prometheus and can also provide alerts when problems occur.
- Together, they provide a complete monitoring solution that helps you understand the performance and health of applications and infrastructure.
Installation Steps
Step 1: Add Repositories. Add the following helm repositories by the commands below.
$ helm repo add prometheus-community https://prometheus-community.github.io/helm-charts/
$ helm repo add stable https://charts.helm.sh/stable/
Step 2: Update Helm Repositories. After we add the helm repositories, we have to update the helm repo by the following command.
$ helm repo update
Step 3: Install Prometheus Kubernetes
$ helm install prometheus prometheus-community/kube-prometheus-stack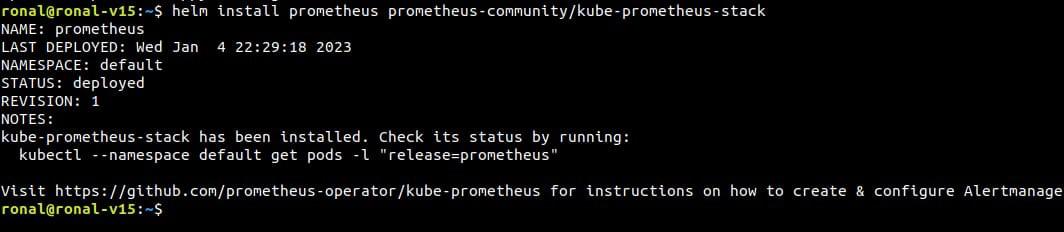
Step 4: Kubernetes Prometheus Port Forward
$ kubectl port-forward deployment/prometheus-grafana 3000
Step 5: Log in to Grafana.
Open your browser and type localhost:3000. Since you are logging in for the first time, you will have to use a default username and password. However, you can create new users and update passwords later. Use the default credentials for now
- username: admin
- password: prom-operator

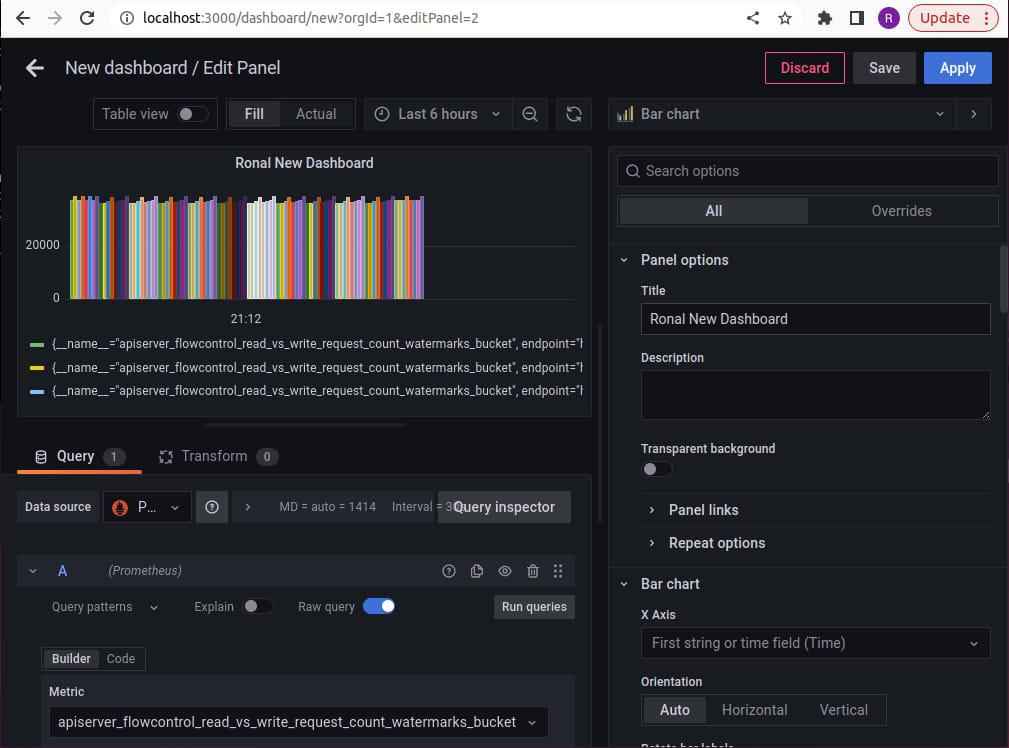
Step 6: Open your dashboard to view and monitor the collected metrics.