A Healthcare Data Analysis project uses SQL to analyze healthcare data and gain insights into patient information, medical conditions, hospital performance, treatment outcomes and healthcare costs.
- Uses MySQL to store and manage healthcare data.
- Uses SQL queries to retrieve, filter and analyze data.
- Supports analysis of patients, doctors, hospitals, diagnoses, treatments, admissions and billing.
Creating the Healthcare Database & Tables
There are mainly 3 steps required for data analysis. Here is how SQL can help analyze healthcare data efficiently.
Step 1: Creating your database and tables
CREATE TABLE patients (
    patient_id INT PRIMARY KEY,
    name VARCHAR(150) NOT NULL,
    age INT,
    gender VARCHAR(20)
);

CREATE TABLE doctors (
    doctor_id INT PRIMARY KEY,
    doctor_name VARCHAR(150) NOT NULL,
    specialization VARCHAR(100) NOT NULL
);

CREATE TABLE hospitals (
    hospital_id INT PRIMARY KEY,
    hospital_name VARCHAR(200) NOT NULL,
    location VARCHAR(150)
);

CREATE TABLE diagnoses (
    diagnosis_id INT PRIMARY KEY,
    diagnosis_name VARCHAR(255) NOT NULL
);

CREATE TABLE treatments (
    treatment_id INT PRIMARY KEY,
    treatment_name VARCHAR(255) NOT NULL
);

CREATE TABLE admissions (
    admission_id INT PRIMARY KEY,
    patient_id INT,
    doctor_id INT,
    hospital_id INT,
    diagnosis_id INT,
    treatment_id INT,
    admission_date DATE,
    discharge_date DATE,
    FOREIGN KEY (patient_id) REFERENCES patients(patient_id),
    FOREIGN KEY (doctor_id) REFERENCES doctors(doctor_id),
    FOREIGN KEY (hospital_id) REFERENCES hospitals(hospital_id),
    FOREIGN KEY (diagnosis_id) REFERENCES diagnoses(diagnosis_id),
    FOREIGN KEY (treatment_id) REFERENCES treatments(treatment_id)
);

CREATE TABLE billing (
    bill_id INT PRIMARY KEY,
    patient_id INT,
    admission_id INT,
    bill_amount DECIMAL(10,2),
    FOREIGN KEY (patient_id) REFERENCES patients(patient_id),
    FOREIGN KEY (admission_id) REFERENCES admissions(admission_id)
);
Output:
Table: paitents

Table: doctors

Table: hospital

Table: diagnoses

Table: treatments

Table: admissions

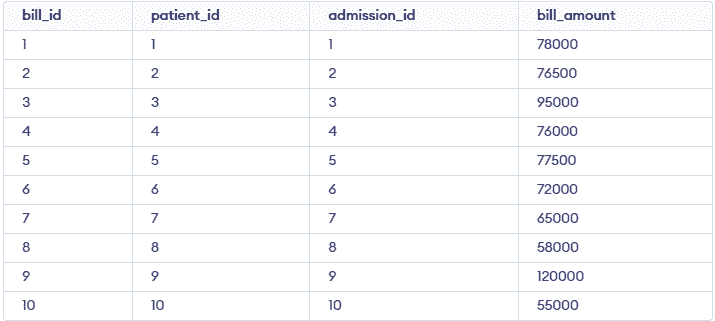
Table: billing

Step 2: Loading your data
-- Insert data into patients table
INSERT INTO patients VALUES
(1, 'John Smith', 45, 'Male'),
(2, 'Emily Johnson', 32, 'Female'),
(3, 'Michael Brown', 58, 'Male'),
(4, 'Sophia Williams', 27, 'Female'),
(5, 'David Miller', 65, 'Male'),
(6, 'Olivia Davis', 41, 'Female'),
(7, 'James Wilson', 52, 'Male'),
(8, 'Emma Anderson', 36, 'Female'),
(9, 'Robert Taylor', 70, 'Male'),
(10, 'Ava Thomas', 29, 'Female');

-- Insert data into doctors table
INSERT INTO doctors VALUES
(1, 'Dr. James Carter'),
(2, 'Dr. Sarah Wilson'),
(3, 'Dr. Robert Anderson'),
(4, 'Dr. Jennifer Brown'),
(5, 'Dr. William Davis');

-- Insert data into hospitals table
INSERT INTO hospitals VALUES
(1, 'Central Clinic'),
(2, 'Riverbank Medical Center'),
(3, 'Sunrise Hospital'),
(4, 'Metro Health'),
(5, 'Wellness Center'),
(6, 'Lakeside Clinic'),
(7, 'City Hospital'),
(8, 'Northern Health'),
(9, 'Greenfield Medical'),
(10, 'Southwest Hospital');

-- Insert data into diagnoses table
INSERT INTO diagnoses VALUES
(1, 'Pneumonia'),
(2, 'Hypertension'),
(3, 'Asthma'),
(4, 'Heart Disease'),
(5, 'Liver Cirrhosis'),
(6, 'Kidney Disease'),
(7, 'Diabetes'),
(8, 'Arthritis'),
(9, 'Migraine'),
(10, 'Anemia');

-- Insert data into treatments table
INSERT INTO treatments VALUES
(1, 'Oxygen Therapy'),
(2, 'Medication'),
(3, 'Inhalers'),
(4, 'Radiation Therapy'),
(5, 'Surgery');

-- Insert data into admissions table
INSERT INTO admissions VALUES
(1, 1, 1, 1, 1, 1, '2024-01-05', '2024-01-12'),
(2, 2, 2, 2, 2, 2, '2024-01-10', '2024-01-18'),
(3, 3, 3, 3, 3, 3, '2024-01-15', '2024-01-22'),
(4, 4, 4, 4, 4, 4, '2024-02-01', '2024-02-15'),
(5, 5, 5, 5, 5, 5, '2024-02-10', '2024-02-20'),
(6, 6, 1, 6, 2, 6, '2024-02-15', '2024-02-25'),
(7, 7, 2, 7, 2, 7, '2024-03-01', '2024-03-10'),
(8, 8, 3, 3, 3, 8, '2024-03-05', '2024-03-15'),
(9, 9, 4, 1, 1, 9, '2024-03-10', '2024-03-20'),
(10, 10, 5, 2, 2, 10, '2024-03-15', '2024-03-25');

-- Insert data into billing table
INSERT INTO billing VALUES
(1, 1, 1, 78000.00),
(2, 2, 2, 76500.00),
(3, 3, 3, 77000.00),
(4, 4, 4, 76000.00),
(5, 5, 5, 77500.00),
(6, 6, 6, 78000.00),
(7, 7, 7, 76500.00),
(8, 8, 8, 77000.00),
(9, 9, 9, 76000.00),
(10, 10, 10, 77500.00);
Output:
Table: paitents
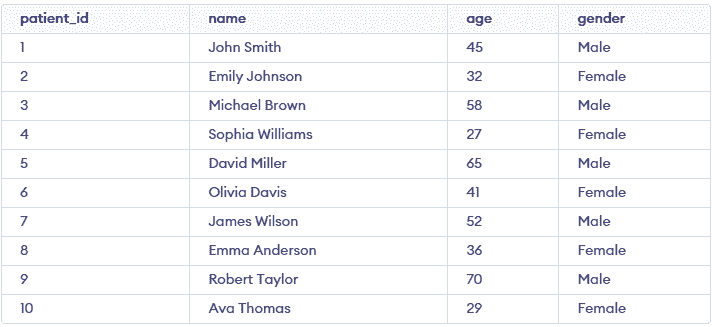
Table: doctors
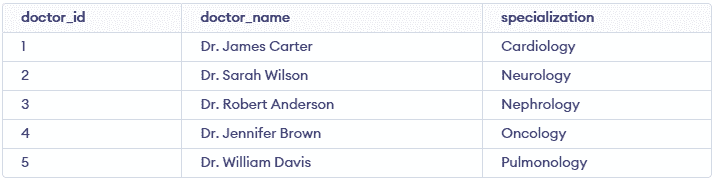
Table: diagnoses
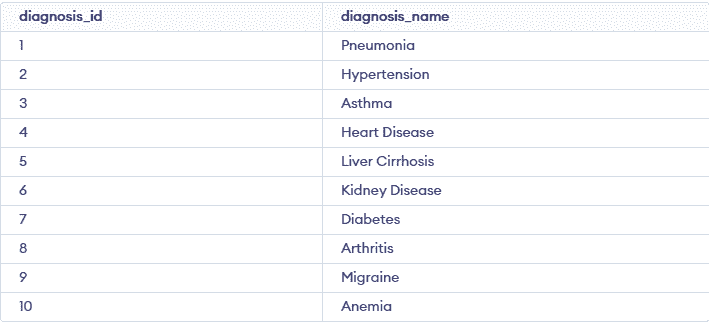
Table: treatments
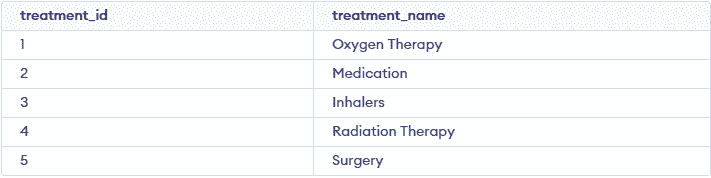
Table: admissions
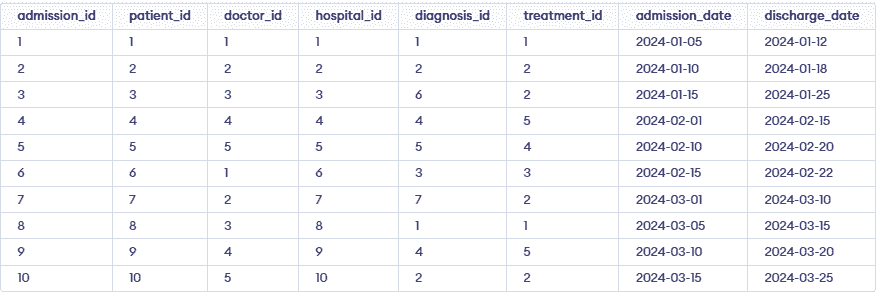
Table: billing
Step 3. Analyzing your data using SQL queries
Let's perform some SQL queries to get quick insights are defined below:
1. Get all patients with Kidney Disease
Retrieve the details of all patients diagnosed with Kidney Disease.
SELECT
    p.patient_id,
    p.name,
    p.age,
    p.gender,
    t.treatment_name,
    d.doctor_name,
    b.bill_amount
FROM patients p
JOIN admissions a ON p.patient_id = a.patient_id
JOIN diagnoses dg ON a.diagnosis_id = dg.diagnosis_id
JOIN treatments t ON a.treatment_id = t.treatment_id
JOIN doctors d ON a.doctor_id = d.doctor_id
JOIN billing b ON a.admission_id = b.admission_id
WHERE dg.diagnosis_name = 'Kidney Disease';
Output:

Explanation: This query selects the relevant details of patients diagnosed with 'Kidney Disease' by filtering the rows where the Diagnosis column matches 'Kidney Disease'. The selected columns include patient ID, name, age, gender, treatment, doctor and the bill amount.
2. Total bill amount by hospital
Calculate the total bill amount generated by each hospital.
SELECT
    h.hospital_name,
    SUM(b.bill_amount) AS total_bill
FROM hospitals h
JOIN admissions a
    ON h.hospital_id = a.hospital_id
JOIN billing b
    ON a.admission_id = b.admission_id
GROUP BY h.hospital_name;
Output:
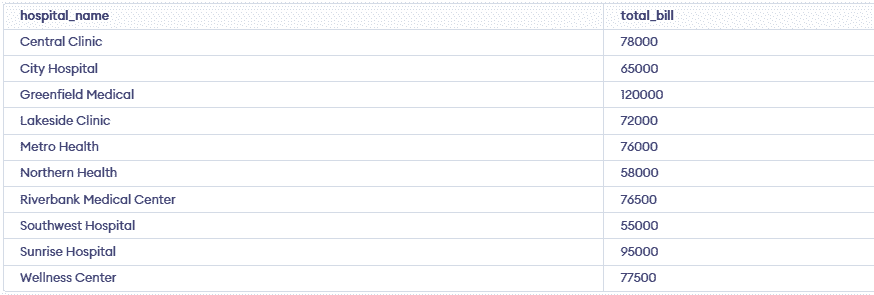
Explanation: This query groups the data by Hospital_Name and calculates the total bill amount (SUM(Bill_Amount)) for each hospital. The result provides the sum of bill amounts for every hospital in the dataset.
3. Patients discharged after a specific date
List the patients who were discharged after January 1, 2024.
SELECT
    p.patient_id,
    p.name,
    dg.diagnosis_name,
    a.discharge_date
FROM patients p
JOIN admissions a
    ON p.patient_id = a.patient_id
JOIN diagnoses dg
    ON a.diagnosis_id = dg.diagnosis_id
WHERE a.discharge_date > '2024-01-01';
Output:
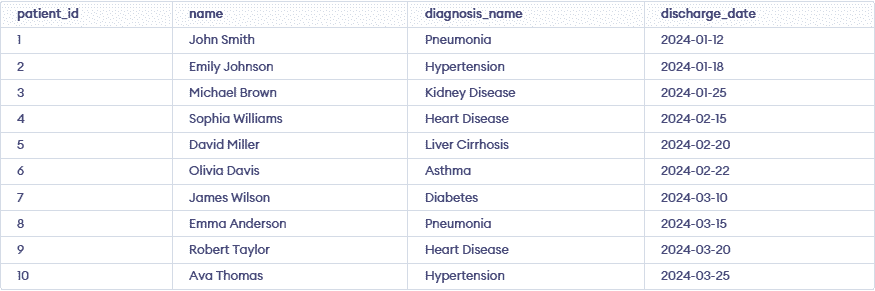
Explanation: This query filters the data to retrieve patients whose Discharge_Date is later than January 1, 2024. The output includes patient ID, name, diagnosis and discharge date for each relevant patient.
4. Average age of patients by treatment
Calculate the average age of patients receiving each type of treatment.
SELECT
    t.treatment_name,
    AVG(p.age) AS average_age
FROM patients p
JOIN admissions a
    ON p.patient_id = a.patient_id
JOIN treatments t
    ON a.treatment_id = t.treatment_id
GROUP BY t.treatment_name;
Output:

Explanation: This query groups the data by Treatment and calculates the average age (AVG(Age)) of patients receiving each type of treatment. It helps in understanding the age distribution for each treatment type.
5. Patients with the highest bill amount
Find the top 5 patients with the highest bill amounts.
SELECT
    p.patient_id,
    p.name,
    b.bill_amount
FROM patients p
JOIN billing b
    ON p.patient_id = b.patient_id
ORDER BY b.bill_amount DESC
LIMIT 5;
Output:

Explanation: This query sorts the data by Bill_Amount in descending order (DESC) and limits the result to the top 5 records. This helps identify the patients who have the highest treatment costs.
Advanced Data Analysis With Dashboard Creation
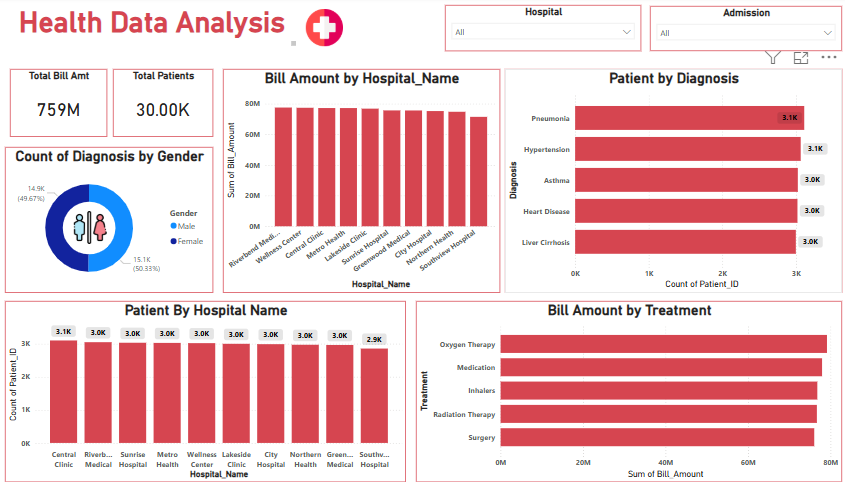
The Power BI dashboard presents key healthcare insights through the following visuals:
Key Performance Indicators (KPIs)
KPIs help measure hospital performance and financial health. The two primary KPIs in this dashboard are:
- Total Sales Amount: Shows the total billing amount.
- Total Patients: Shows the total number of patients.
Bill Amount by Hospital Name
The stacked column chart shows the total billing amount for each hospital.
- X-axis: Hospital Name
- Y-axis: Total Bill Amount
Patients by Diagnosis
The stacked column chart shows the number of patients diagnosed with different medical conditions.
- X-axis: Diagnosis
- Y-axis: Number of Patients
Patients by Hospital Name
The stacked column chart shows the distribution of patients across different hospitals.
- X-axis: Hospital Name
- Y-axis: Number of Patients
Gender Distribution
The donut chart shows the distribution of patients by gender.
- Male
- Female
- Other
Slicers
Slicers allow users to filter the dashboard interactively.
- Hospital Name: Filters data by hospital.
- Admission Date: Filters data by admission date.