

Bookstore Analytics is a SQL-based project designed to analyze bookstore data and generate meaningful insights from sales, books and customer records.
- Uses SQL to create and manage bookstore data.
- Stores information about books, customers, orders and sales.
- Helps identify sales trends, popular books, customer purchasing patterns and overall bookstore performance.
Tools & Technologies
- SQL (SQLite/PostgreSQL/MySQL)
- Subqueries, Joins, Aggregations
- Common Table Expressions (CTEs)
Creating the Bookstore Database & Tables
In this section, we will create the required database and tables, insert sample bookstore data and execute SQL queries to analyze the data and generate useful insights.
Dataset Overview
The bookstore database includes four key tables that represents books, customers, orders and marketing efforts. Each table connects through primary and foreign keys to form a robust relational database.
| Table | Description |
|---|---|
| Books | Contains book details and stock |
| Customers | Customer info with city and signup date |
| Orders | Purchase data linking books and customers |
| MarketingSpend | Cost to acquire each customer |
Step-by-Step Implementation
Below are the steps that you can follow for implementing this project:
Step 1: Create the Database Schema
We begin by creating the tables using SQL CREATE TABLE statements. These include foreign key relationships for orders and marketing spend.
-- 1. books table
CREATE TABLE books (
    book_id INT PRIMARY KEY,
    title VARCHAR(200),
    genre VARCHAR(100),
    price DECIMAL(6,2),
    stock INT
);

-- 2. customers table
CREATE TABLE customers (
    customer_id INT PRIMARY KEY,
    name VARCHAR(150),
    city VARCHAR(100),
    signup_date DATE
);

-- 3. orders table
CREATE TABLE orders (
    order_id INT PRIMARY KEY,
    customer_id INT,
    book_id INT,
    quantity INT,
    order_date DATE,
    FOREIGN KEY (customer_id) REFERENCES customers(customer_id),
    FOREIGN KEY (book_id) REFERENCES books(book_id)
);

-- 4. marketing_spend table
CREATE TABLE marketing_spend (
    spend_id INT PRIMARY KEY,
    customer_id INT,
    spend_amount DECIMAL(7,2),
    FOREIGN KEY (customer_id) REFERENCES customers(customer_id)
);
Output:
Table: books

Table: customers

Table: orders

Table: marketing_spend

Step 2: Insert Sample Data
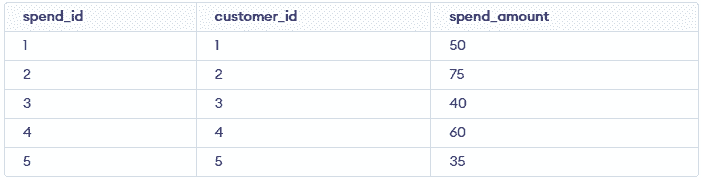
In this step we will insert sample data into all four tables: Books, Customers, Orders and MarketingSpend
-- books
INSERT INTO books VALUES
(1, 'Data Science 101', 'Education', 29.99, 100),
(2, 'The Art of SQL', 'Technology', 34.50, 50),
(3, 'Mystery at the Bookstore', 'Fiction', 15.00, 20),
(4, 'Learn Python the Hard Way', 'Education', 40.00, 30),
(5, 'Fantasy World Chronicles', 'Fantasy', 22.50, 10);

-- customers
INSERT INTO customers VALUES
(1, 'Alice', 'New York', '2023-01-10'),
(2, 'Bob', 'San Francisco', '2023-03-15'),
(3, 'Charlie', 'Austin', '2023-06-20'),
(4, 'Diana', 'New York', '2024-01-10'),
(5, 'Evan', 'Chicago', '2024-04-05');

-- orders
INSERT INTO orders VALUES
(1, 1, 1, 2, '2024-06-01'),
(2, 2, 2, 1, '2024-06-02'),
(3, 1, 3, 1, '2024-06-03'),
(4, 3, 1, 3, '2024-06-04'),
(5, 4, 5, 2, '2024-06-04'),
(6, 5, 2, 2, '2024-06-05'),
(7, 2, 4, 1, '2024-06-05'),
(8, 1, 1, 1, '2024-06-06');

-- marketing_spend
INSERT INTO marketing_spend VALUES
(1, 1, 50.00),
(2, 2, 75.00),
(3, 3, 40.00),
(4, 4, 60.00),
(5, 5, 35.00);
Output:
Table: books
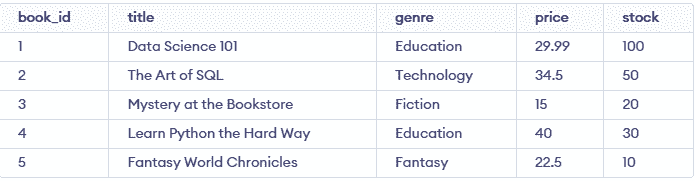
Table: customers
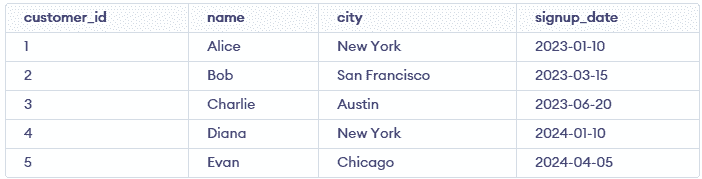
Table: orders
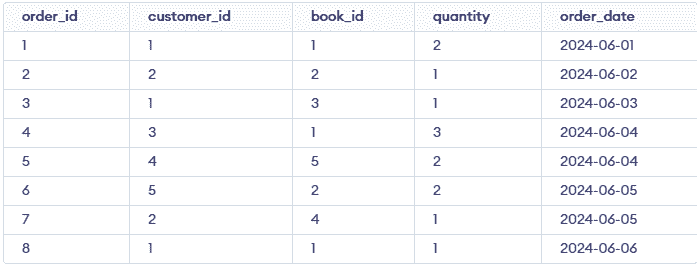
Table: marketing_spend
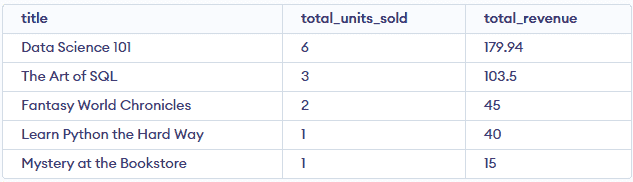
Step 3: Analyze Book Performance
Here we will use SQL Joins and aggregations to calculate total units sold and total revenue per book.
SELECT
    b.title,
    SUM(o.quantity) AS total_units_sold,
    SUM(o.quantity * b.price) AS total_revenue
FROM orders o
JOIN books b ON o.book_id = b.book_id
GROUP BY b.title
ORDER BY total_revenue DESC;
Output:
Step 4: Inventory Alerts
In this step we will trigger alerts for books running low on stock. We need to maintain healthy stock levels to prevent lost sales
SELECT
    title, stock
FROM books
WHERE stock < 15;
Output:

Step 5: Segment Customers Using RFM Analysis
Use a Common Table Expression (CTE) to understand top customers and create segments.
- Recency: Time since last purchase
- Frequency: Number of orders
- Monetary: Total spent
WITH customer_metrics AS (
    SELECT
        c.customer_id,
        c.name,
        MAX(order_date) AS last_order,
        COUNT(o.order_id) AS frequency,
        SUM(o.quantity * b.price) AS monetary
    FROM customers c
    JOIN orders o ON c.customer_id = o.customer_id
    JOIN Books b ON o.book_id = b.book_id
    GROUP BY c.customer_id
)
SELECT *,
       DATEDIFF(DAY, last_order, '2024-07-01') AS recency_days
FROM customer;
Output:

Step 6: Evaluate Marketing ROI
Compare customer lifetime revenue vs acquisition cost using joins and subqueries. We can say how much return you are getting per customer on marketing spend.
WITH customer_spend AS (
    SELECT
        o.customer_id,
        SUM(o.quantity * b.price) AS total_revenue
    FROM orders o
    JOIN books b ON o.book_id = b.book_id
    GROUP BY o.customer_id
)
SELECT
    c.customer_id,
    c.name,
    ms.spend_amount,
    cs.total_revenue,
    (cs.total_revenue - ms.spend_amount) AS profit
FROM customers c
JOIN marketing_spend ms ON c.customer_id = ms.customer_id
JOIN customer_spend cs ON c.customer_id = cs.customer_id;
Output:

Step 7: Monthly Sales Trend
This step tracks how many books were sold and the total revenue generated each month. It helps identify sales seasonality and evaluate the performance of promotional campaigns.
SELECT
    STRFTIME('%Y-%m', order_date) AS month,
    SUM(quantity * b.price) AS total_revenue
FROM orders o
JOIN books b ON o.book_id = b.book_id
GROUP BY month
ORDER BY month;
Output:

Step 8: Returning Customers
This query identifies customers who have placed more than one order. It helps assess customer loyalty and repeat engagement with the store.
SELECT
    c.customer_id,
    c.name,
    COUNT(DISTINCT o.order_id) AS total_orders
FROM customers c
JOIN orders o ON c.customer_id = o.customer_id
GROUP BY c.customer_id
HAVING total_orders > 1;
Output:

Step 9: Average Order Value (AOV)
This step calculates how much revenue is generated per order on average. It is a key business metric for understanding customer purchasing behavior.
SELECT
    ROUND(SUM(quantity * b.price) * 1.0 / COUNT(DISTINCT o.order_id), 2) AS avg_order_value
FROM orders o
JOIN books b ON o.book_id = b.book_id;
Output:

Step 10: Books Frequently Bought Together
Identify books that are often purchased by the same customer, enabling better recommendations and bundle promotions. Use this to suggest complementary books during checkout.
SELECT
    o1.book_id AS book_1,
    o2.book_id AS book_2,
    COUNT(*) AS times_bought_together
FROM orders o1
JOIN orders o2
  ON o1.customer_id = o2.customer_id AND o1.order_id != o2.order_id
WHERE o1.book_id < o2.book_id
GROUP BY book_1, book_2
ORDER BY times_bought_together DESC
LIMIT 10;
Output:

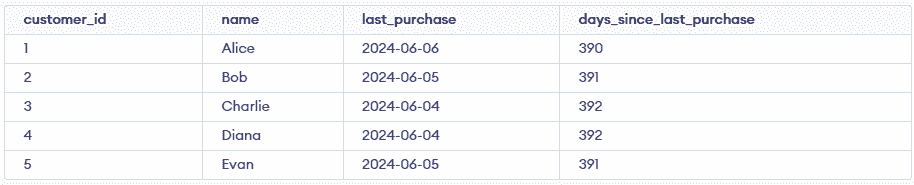
Step 11: Churned Customers
This step detects customers who haven’t made a purchase in the last 365 days, identifying users who may need re-engagement campaigns.
SELECT
    c.customer_id,
    c.name,
    MAX(o.order_date) AS last_purchase,
    DATEDIFF(DAY, MAX(o.order_date), '2025-07-01') AS days_since_last_purchase
FROM customers c
JOIN orders o
    ON c.customer_id = o.customer_id
GROUP BY c.customer_id
HAVING DATEDIFF(DAY, MAX(o.order_date), '2025-07-01') > 365;
Output:
You can download the complete project files and SQL scripts from the link below: Bookstore Analytics with SQL
