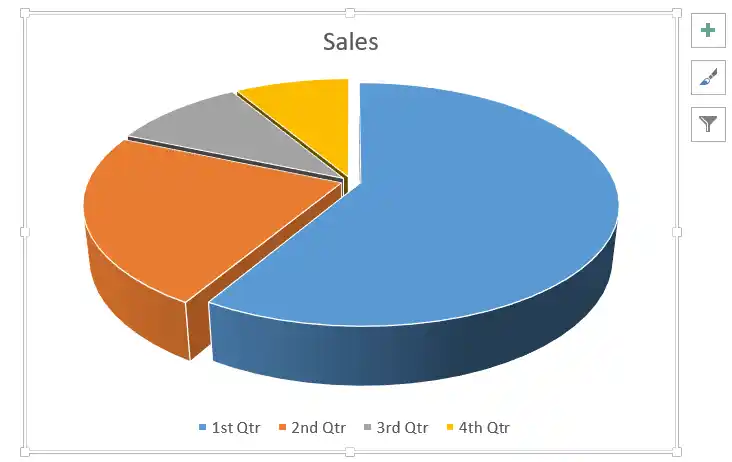
These three chart types are the most commonly used in presentations. Here’s how to create each one in the latest Microsoft PowerPoint.
1. Insert a Bar Chart (or Column Chart)
Bar charts (horizontal) and Column charts (vertical) are ideal for comparing values across categories.
Step 1: Go to the slide where you want the chart.

Step 2: On the Insert tab, click Chart.
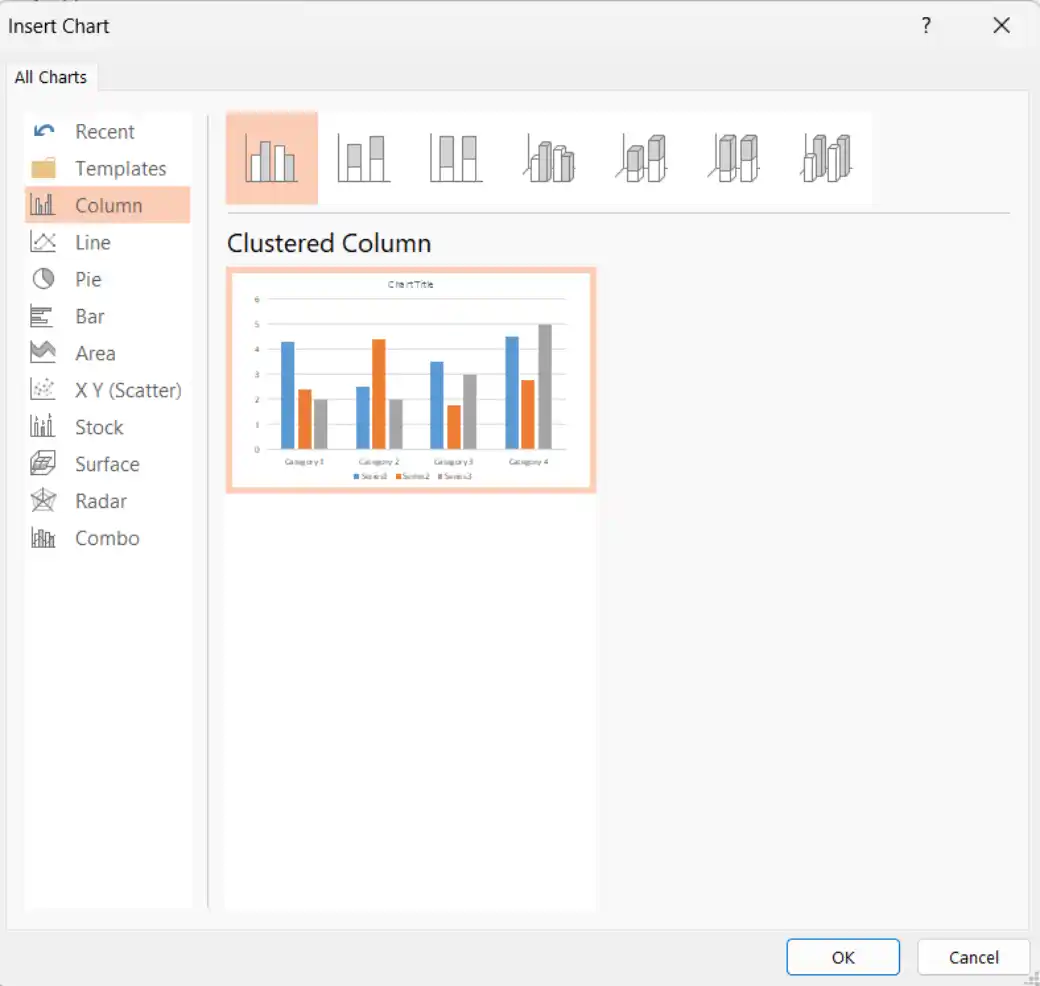
Step 3: In the left panel, select Bar (for horizontal bars) or Column (for vertical bars).
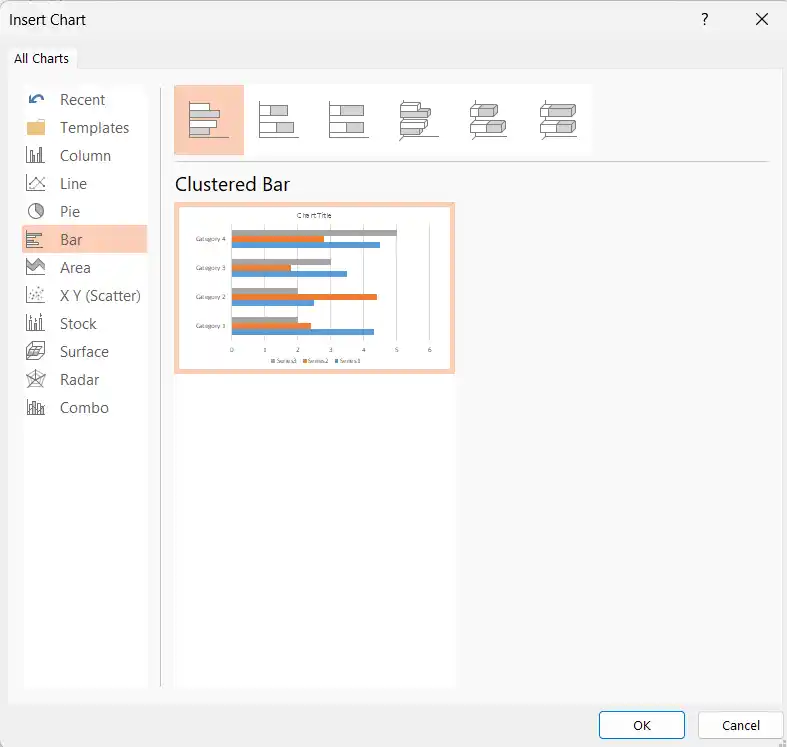
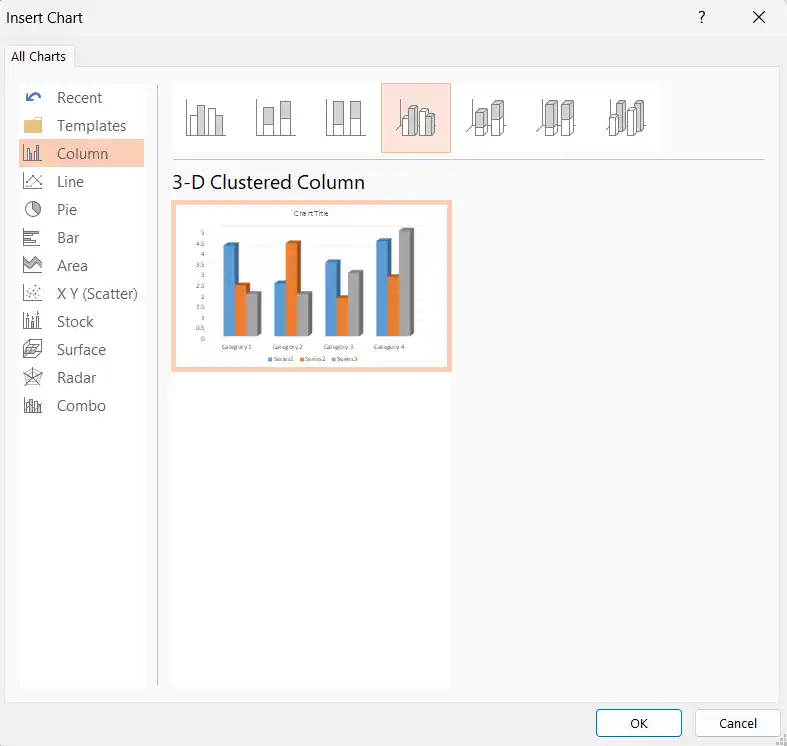
Step 4: Choose a style such as Clustered Bar/Column or Stacked Bar/Column, then click OK.
Step 5: In the Excel window that opens, replace the sample data with your own categories and values.
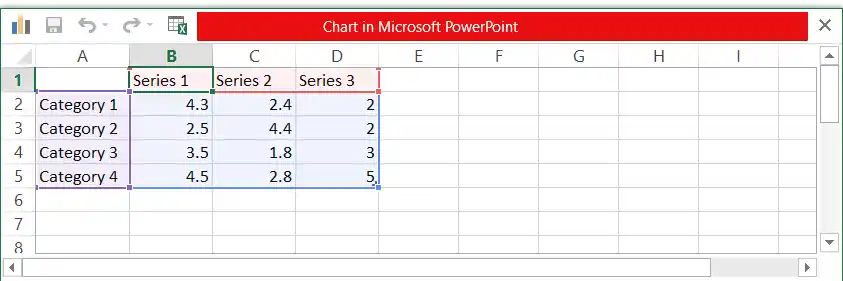
Step 6: Close the Excel window. The chart updates automatically.
When to use:
- Column charts: Best for time-based data or short category names.
- Bar charts: Better when category names are long.
2. Insert a Line Chart
Line charts are perfect for showing trends over time.
Step 1: Go to Insert and select Chart.
Step 2: Select Line from the left panel.
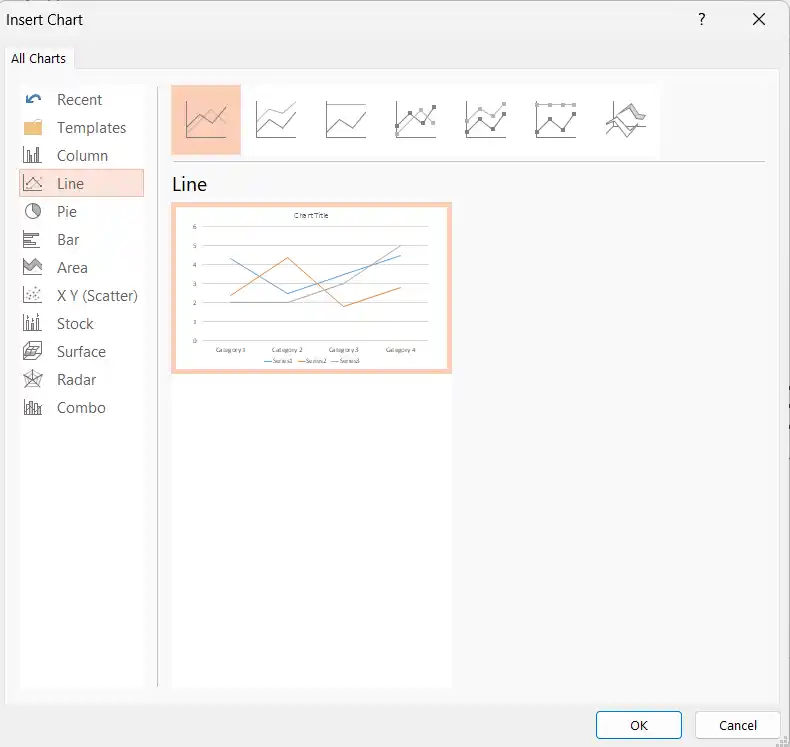
Step 3: Choose a style (basic Line, Line with Markers, or Stacked Line) and click OK.
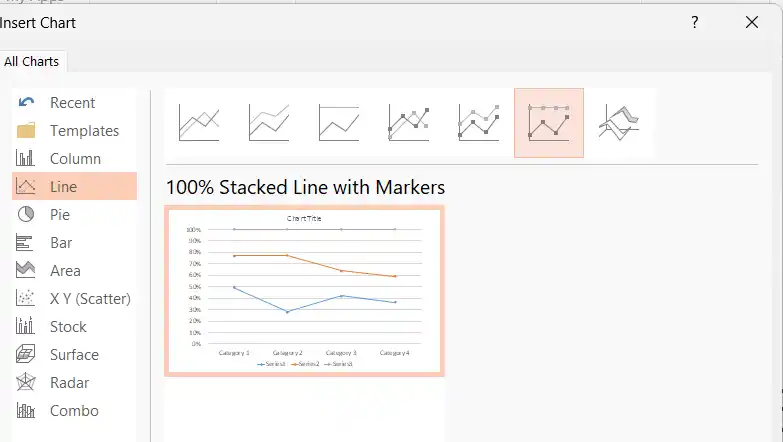
Step 4: Enter your data in the Excel window (usually time periods in the first column and values in the following columns).
Step 5: Close the Excel window when finished.
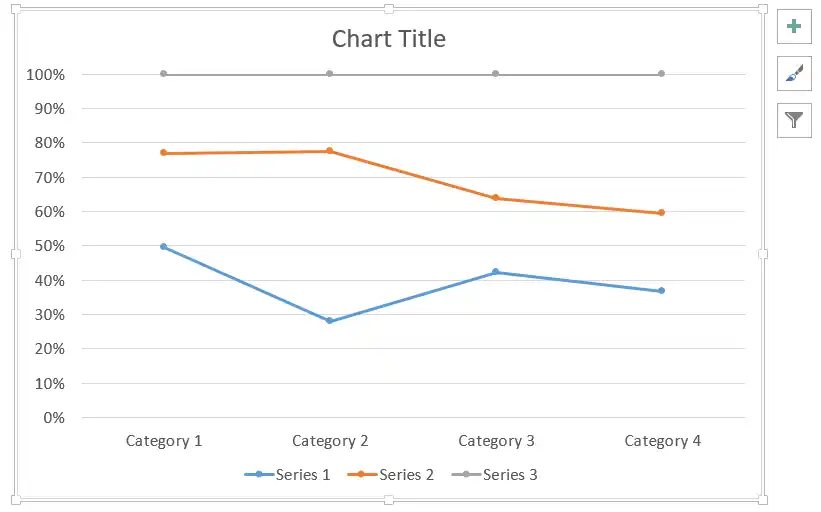
Tip: Use markers if you want to highlight individual data points.
3. Insert a Pie Chart
Pie charts show parts of a whole (percentages or proportions).
Step 1: Go to Insert click on Chart.
Step 2: Select Pie from the left panel.
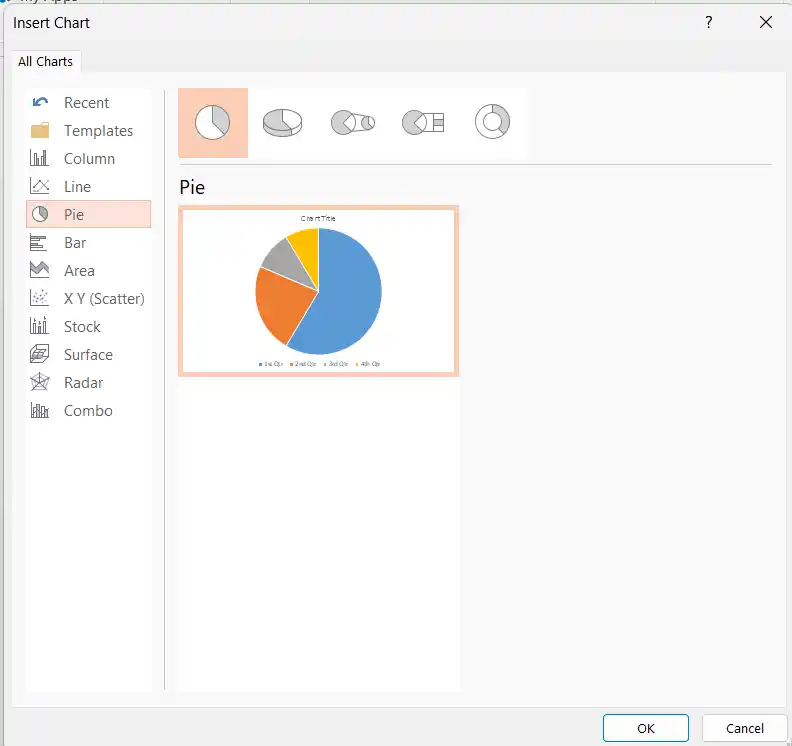
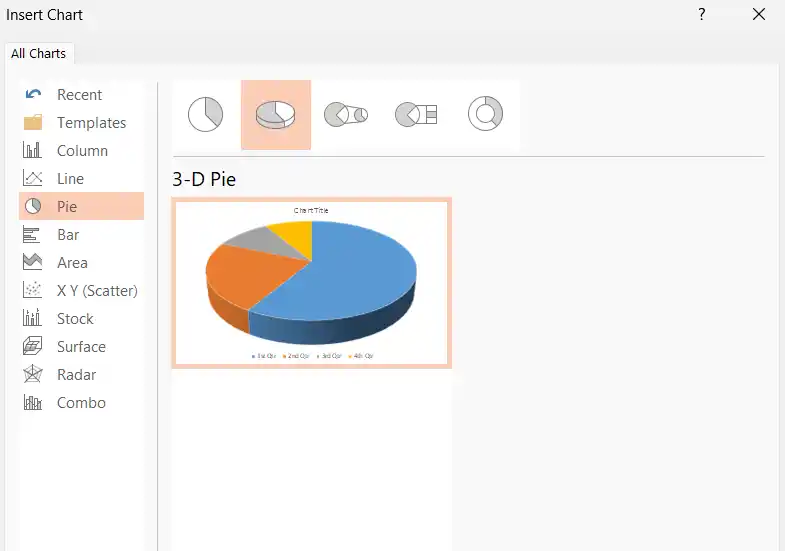
Step 3: Choose a style (standard Pie, 3-D Pie, Pie) and click OK.
Step 4: Enter your data in the Excel window one column for categories and one column for values.
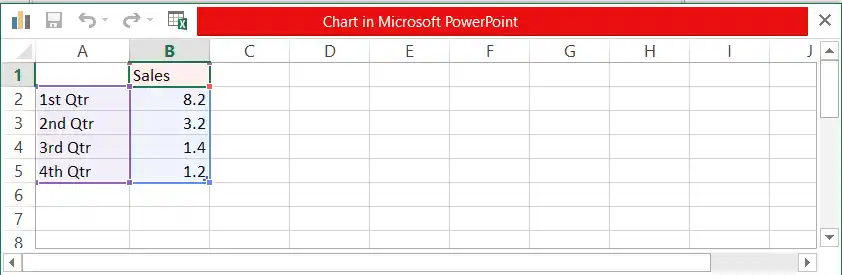
Step 5: Close the Excel window.