

Mean, variance, and standard deviation are important statistical measures used to analyze data.
- Mean represents the average value of a dataset.
- Variance measures how far the data values are spread from the mean.
- Standard deviation indicates the amount of variation or dispersion in the data.
These concepts help engineers and researchers understand data patterns, variability, and trends, enabling better analysis and decision-making.
Mean
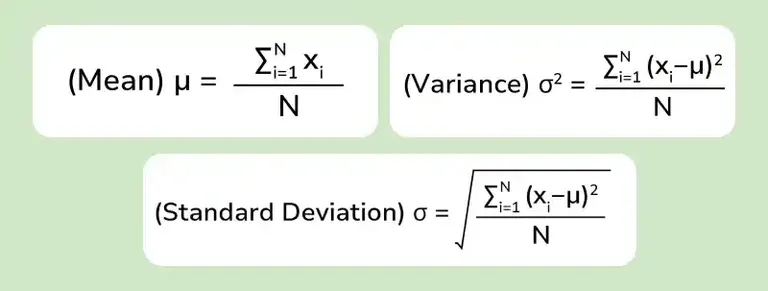
The mean also known as the average, is a measure of the central tendency of a dataset. It is calculated by summing up all the values in the dataset and dividing them by the number of values. It is denoted by the symbol μ.
Formula
For a dataset with n values x1, x2, x3, ......., xn the mean μ is given by:
μ =
\frac{1}{n} \sum_{i=1}^{n}x_i
Example: Find the mean (average) of the following dataset: {4, 8, 6, 5, 3, 7}
μ = 4 + 8 + 6 + 5 + 3 + 7 / 6
= 33/6
= 5.5
Variance
Variance measures the dispersion of a dataset, indicating how much the values differ from the mean. It is the average of the squared differences from the mean.
Formula
For a dataset with n values x1, x2, x3, ......., xn the mean σ2 is given by:
σ2 =
\frac{1}{n} \sum_{i=1}^{n} (x_i - \mu)^2
Example: Find the variance of the following dataset {4, 8, 6, 5, 3, 7} with mean = 5.5.
σ2 = (4 - 5.5)2 + (8 - 5.5)2 + (6−5.5)2 + (5−5.5)2 + (3−5.5)2 + (7- 5.5)2 / 6
σ2 = 17.5/6 = 2.92
Standard Deviation
Standard deviation is the square root of the variance, providing a measure of the spread of the dataset in the same units as the data.
Formula
For a dataset with n values x1, x2, x3, ......., xn the mean σ is given by:
σ =
\sqrt σ2 =\sqrt {\frac{1}{n} \sum_{i=1}^{n} (x_i - \mu)^2}
Example: Find the standard deviation of the following dataset {4, 8, 6, 5, 3, 7}, with variance σ2 = 2.92.
To find the standard deviation of the dataset {4, 8, 6, 5, 3, 7} with a given variance of σ² = 2.92, we use the following formula:
σ = √σ2Given that the variance σ2 = 2.92, we can calculate the standard deviation σ:
σ = 2.92 = 1.71So, the standard deviation is 1.71.
Relationship between Mean, Variance, and Standard Deviation
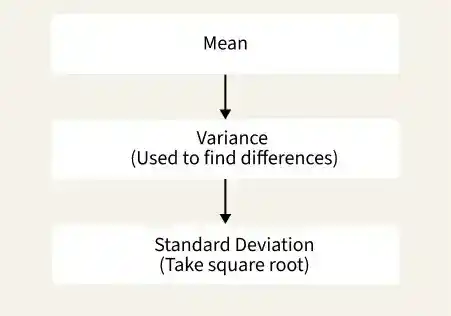
The mean represents the average value of a dataset and indicates its central value. Using the mean, we calculate the variance, which measures how much the data values differ from the average. The standard deviation is the square root of the variance and shows the spread of the data in the same units as the original values, making it easier to interpret.
Example: The dataset below represents the scores of 5 students in a quiz: {5, 7, 9, 11, 13}
- Calculate the mean of the dataset.
- Use the mean to calculate the variance.
- Find the standard deviation from the variance.
Solution:
Step 1: Calculate the Mean
Mean = 5 + 7 + 9 + 11 + 13 /5
= 45 / 5 = 9.Step 2: Calculate the Variance
Subtract the mean from each number, square the result, and find the average:
(5 - 9)² + (7 - 9)² + (9 - 9)² + (11 - 9)² + (13 - 9)
= 16 + 4 + 0 + 4 + 16
= 40
Then, divide by 5: 40 / 5 = 8.Step 3: Calculate the Standard Deviation
- Take the square root of the variance: √8 = 2.83.
- So, the standard deviation is 2.83.
Applications
- Manufacturing and Quality Control: Helps monitor product quality and detect variations in manufacturing processes.
- Signal Processing: Used to analyze signal strength and reduce noise, improving communication accuracy.
- Reliability Engineering: Assists in estimating the lifespan and failure rates of components and systems.
- Financial Engineering: Helps assess investment returns and measure financial risks for better decision-making.
- Civil Engineering: Used to analyze material properties, environmental data, and structural performance to ensure safety and reliability.
