

A line graph, also known as a line chart or line plot, is a tool used for data visualization.
- It is a type of graph that represents the data in a pictorial form, which makes the raw data more easily understandable.
- In a line graph, data points are connected with a straight line, and data points are represented either with points or wedges.
- Some other examples of graphs are bar graphs, histograms, pie charts, line graphs, etc.
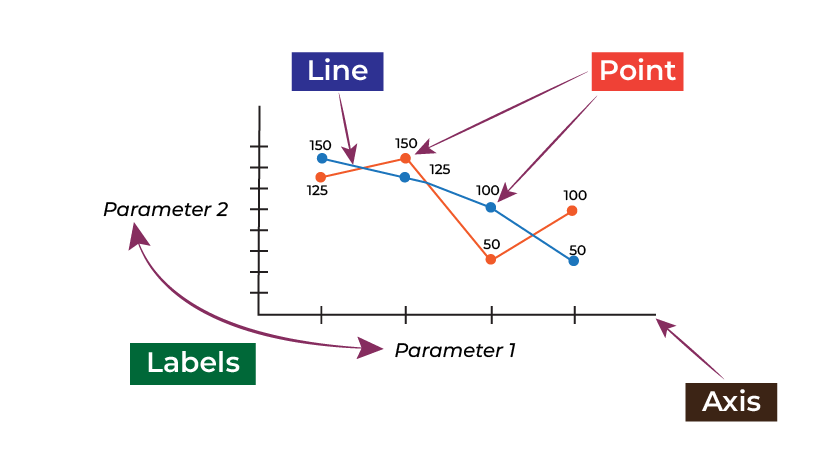
A line graph or line chart is a graphical representation of the data that displays the relationship between two or more variables concerning time. It is made by connecting data points with straight-line segments.
Parts of Line Graph
Parts of the line graph include the following:
- Title: It is nothing but the title of the graph drawn.
- Axes: The line graph contains two axes, i.e., the X-axis and the Y-axis.
- Labels: The names given to the x-axis and y-axis.
- Line: It is the line segment that is used to connect two or more data points.
- Point: It is nothing but a point given at each segment.
How to Draw and Read a Line Graph?
Drawing a Line Graph
To make a line graph, we need to use the following steps:
- Determine the variables: The first and foremost step is to identify the variables you want to plot on the X-axis and Y-axis.
- Choose appropriate scales: Based on your data, determine the appropriate scale.
- Plot the points: Plot the individual data points on the graph according to the given data.
- Connect the points: After plotting the points, you have to connect those points with a line.
- Label the axes: Add labels to the X-axis and Y-axis. You can also include the unit of measurement.
- Add Title: After completing the graph you should provide a suitable title.
Reading a Line Graph
To read a line graph, you need to follow the below-given steps:
- Understand the axes: First, you need to understand the X-axis and Y-axis of the graph.
- Estimate the scale: Look at the values marked along each axis to determine the scale.
- Estimate the values of data points: Look at the data points on the graph to estimate the values on the graph.
- Analyze the pattern: Identify the pattern and analyze it.
- Conclude: Based on the above step find conclusions.
Example: Draw a line graph for the given data.
| No. of Days | 1 | 2 | 3 | 4 |
|---|---|---|---|---|
| Absentees | 5 | 10 | 15 | 10 |
Answer:
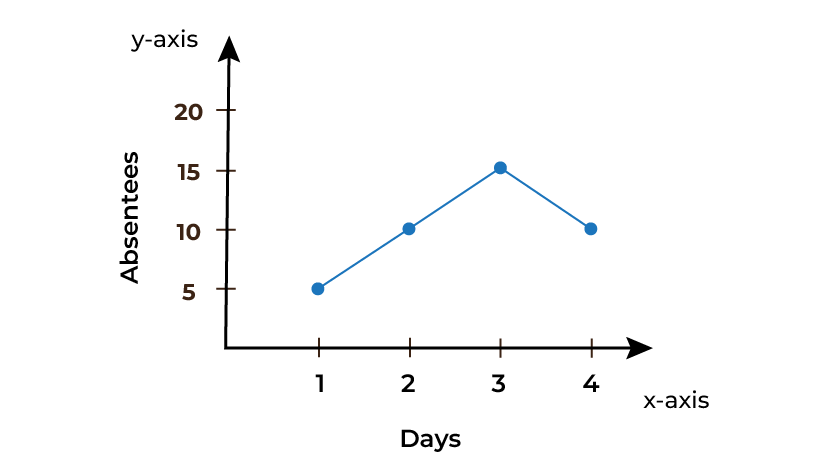
The above diagram shows a line graph between the number of days and the number of absentees.
Types of Line Graphs
Let us discuss the types of line graphs:
- Simple Line Graph
- Multiple Line Graph
- Compound Line Graph
Simple Line Graph
It is the most common type of line graph in which a single line represents the relationship between two variables over time. The above diagram is an example of a basic line graph.
Multiple Line Graph
It is the type of line graph in which we can represent two or more lines in a single graph, and they can either belong to the same categories or different, which makes it easy to make comparisons between them. Multiple line graphs also include a double line graph, or we can say that a double line graph is also a multiple line graph.
An example of multiple graphs is shown below:
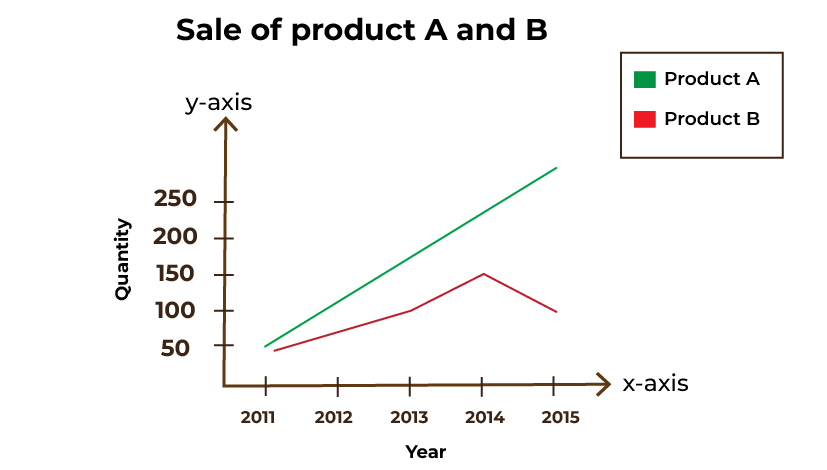
In the above graph, the sale of products A and B is shown in the same graph.
Compound Line Graph
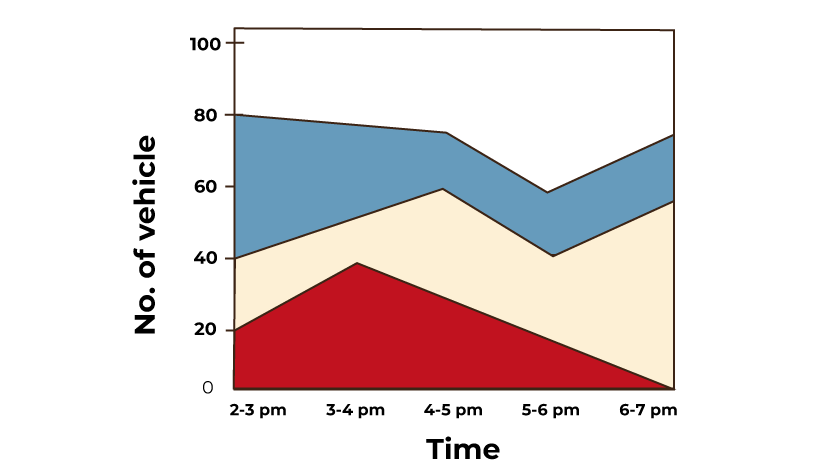
It is a type of line graph in which multiple lines or data are combined into a single graph showing different categories or variables. The main aim of a compound line graph is to represent or display the relationship between different variables on a single graph.
A compound line graph example is shown below:
Advantages of Line Graphs
Some of the advantages of using a line graph are listed below:
- It helps to visualize the data.
- It provides a clear overview of the data.
- It becomes easy to make predictions using a line graph.
- It helps to compare the data more easily.
Note: A line graph is not suitable to show a nonlinear relationship or complex data.
➢Practice: Solved Examples
