

An area chart is a type of chart used to represent data points over a continuous scale, usually time. It is similar to a line chart, but the area between the line and the horizontal axis is filled with color. This makes it useful for showing both trends and the magnitude of values.
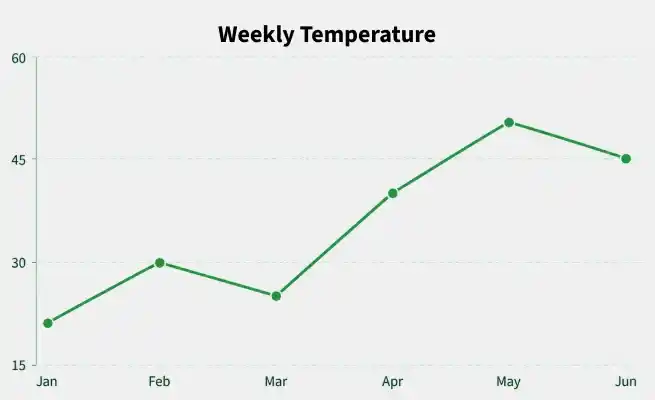
Example 1: Monthly Sales
The monthly sales of a company are given below:
Month | Sales (in units) |
|---|---|
January | 20 |
February | 30 |
March | 25 |
April | 40 |
May | 50 |
June | 45 |
Solution:
To represent this data using an area chart:
- Take months on the X-axis.
- Take sales (in units) on the Y-axis.
- Plot the points: (January,20), (February,30), (March,25), (April,40), (May,50), (June,45)
- Join the points with a line.
- Shade the area between the line and the X-axis.
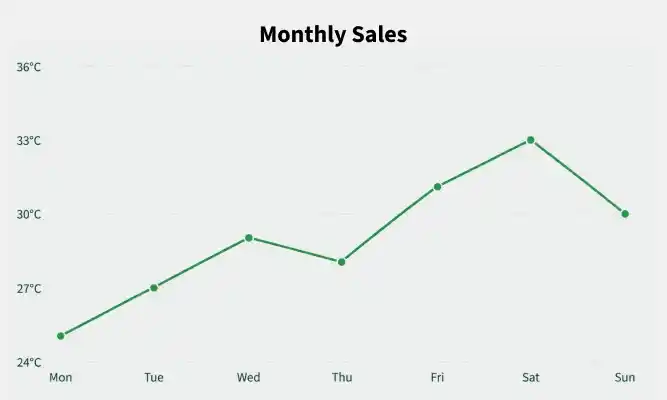
Example 2: Temperature Over a Week
The temperatures recorded over seven days are:
Day | Temperature (in degree) |
|---|---|
Monday | 25 |
Tuesday | 27 |
Wednesday | 29 |
Thursday | 28 |
Friday | 31 |
Saturday | 33 |
Sunday | 30 |
Solution:
The days are placed on the X-axis and temperature on the Y-axis. After plotting and joining the points, the region below the line is shaded.
Interpretation: The temperature reaches its highest value on Saturday and then decreases on Sunday.
Types
1. Simple Area Chart
A simple area chart contains one data series. It is useful for observing the change in one quantity over time.
Example: Monthly revenue of a company.
2. Stacked Area Chart
A stacked area chart contains multiple data series stacked on top of one another. It can be used to show how different components contribute to a total and how those contributions change over time.
Example: A company may track revenue from:
- Product A
- Product B
- Product C
The stacked areas show both the individual contributions and the overall total.
3. 100% Stacked Area Chart
A 100% stacked area chart represents each time period as 100%. It focuses on the proportion or percentage contribution of each category rather than the absolute values.
Example: It can show the percentage share of different products in total sales over time.
Applications
Area charts are commonly used in:
- Business: Revenue and sales trends
- Finance: Changes in financial quantities over time
- Economics: Economic indicators
- Web analytics: Website traffic and users
- Technology: System usage and resource consumption
- Education: Student performance trends
- Science: Changes in measured quantities over time
- Marketing: Campaign performance over time
Practice Questions
Q1. A company's monthly revenue is given below:
Month | Revenue (in lakhs) |
|---|---|
January | 25 |
February | 30 |
March | 28 |
April | 35 |
May | 42 |
June | 38 |
Q2. The following table shows the number of visitors to a website:
Day | Visitors |
|---|---|
Monday | 200 |
Tuesday | 250 |
Wednesday | 320 |
Thursday | 280 |
Friday | 360 |
Saturday | 400 |
Sunday | 450 |
Q3. The production of a manufacturing company is:
Year | Production (in units) |
|---|---|
2019 | 12000 |
2020 | 15000 |
2021 | 14000 |
2022 | 18500 |
2023 | 22000 |
2024 | 20000 |
2025 | 25500 |
Q4. The population of a city over eight years is given below:
Year | Population |
|---|---|
2018 | 120000 |
2019 | 135000 |
2020 | 128000 |
2021 | 150000 |
2022 | 168000 |
2023 | 160000 |
2024 | 185000 |
2025 | 210000 |
