Log inSign up
Log inSign up
Allen Downey
8,169 posts
Allen Downey profile banner
@AllenDowney

Allen Downey

@AllenDowney
Author of Probably Overthinking It, Think Python, and Think Bayes. Emeritus Prof at Olin College, consultant with PyMC Labs.
Boston, MA
allendowney.com
Joined April 2013
1,015 Following
17K Followers
RepliesRepliesRepostsRepostsMediaMedia

Log in or sign up for X

See what’s happening and join the conversation

Continue with phone
or
Log in with username or email
Terms·Privacy·Cookies·Accessibility·Ads Info·© 2026 X Corp.
  • Pinned
    @AllenDowney
    Allen Downey
    @AllenDowney
    Nov 7, 2023
    My copy of Probably Overthinking It has arrived! It should be shipping soon. If you would like to pre-order, you can get 30% from University of Chicago Press. Use the code UCPNEW. press.uchicago.edu/ucp/books/book…
    14
  • @AllenDowney
    Allen Downey
    @AllenDowney
    Sep 29
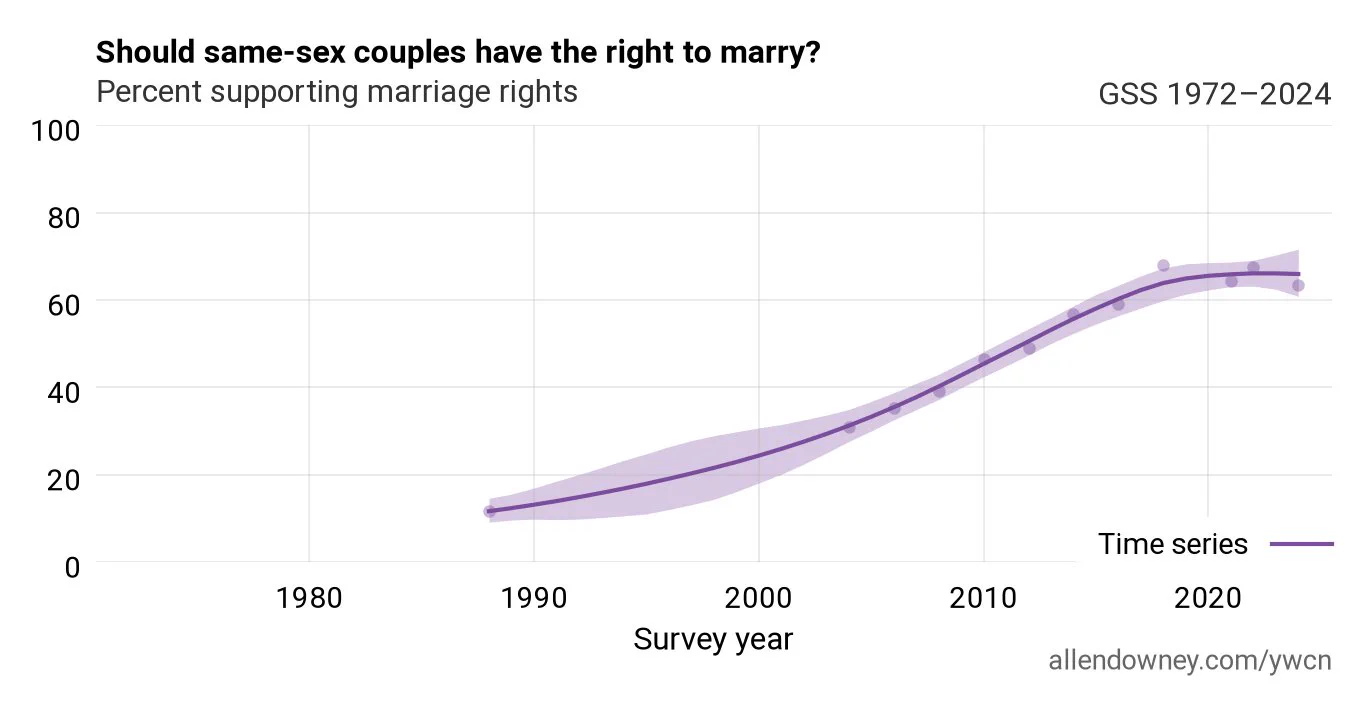
    Do you defend marriage or respect it? If the question is confusing, just remember that the Defense of Marriage Act banned same-sex marriage, and the Respect for Marriage Act allows it.
    Line chart titled “Should same-sex couples have the right to marry?” Subtitle “Percent supporting marriage rights,” GSS. Estimated support rises from about 12% in 1988 to about 66% by 2020, then levels off through 2024, with a shaded uncertainty band around the time-series line and survey points as dots.
    1
  • @AllenDowney
    Allen Downey
    @AllenDowney
    Sep 23
    In 1992, only 28% of Americans said gay couples should be allowed to adopt children. But support grew quickly: by 2008 it was above 50%, and in 2024 it was above 80%. During that period, state laws were all over the map.
    Line chart titled “Should gay couples be allowed to adopt?” Subtitle “Percent favoring adoption rights,” ANES 1992–2024. Estimated support rises from roughly 28% in 1992 to about 81% by 2024, with a shaded uncertainty band around the time-series line and survey points as dots.
    1
  • @AllenDowney
    Allen Downey
    @AllenDowney
    Sep 16
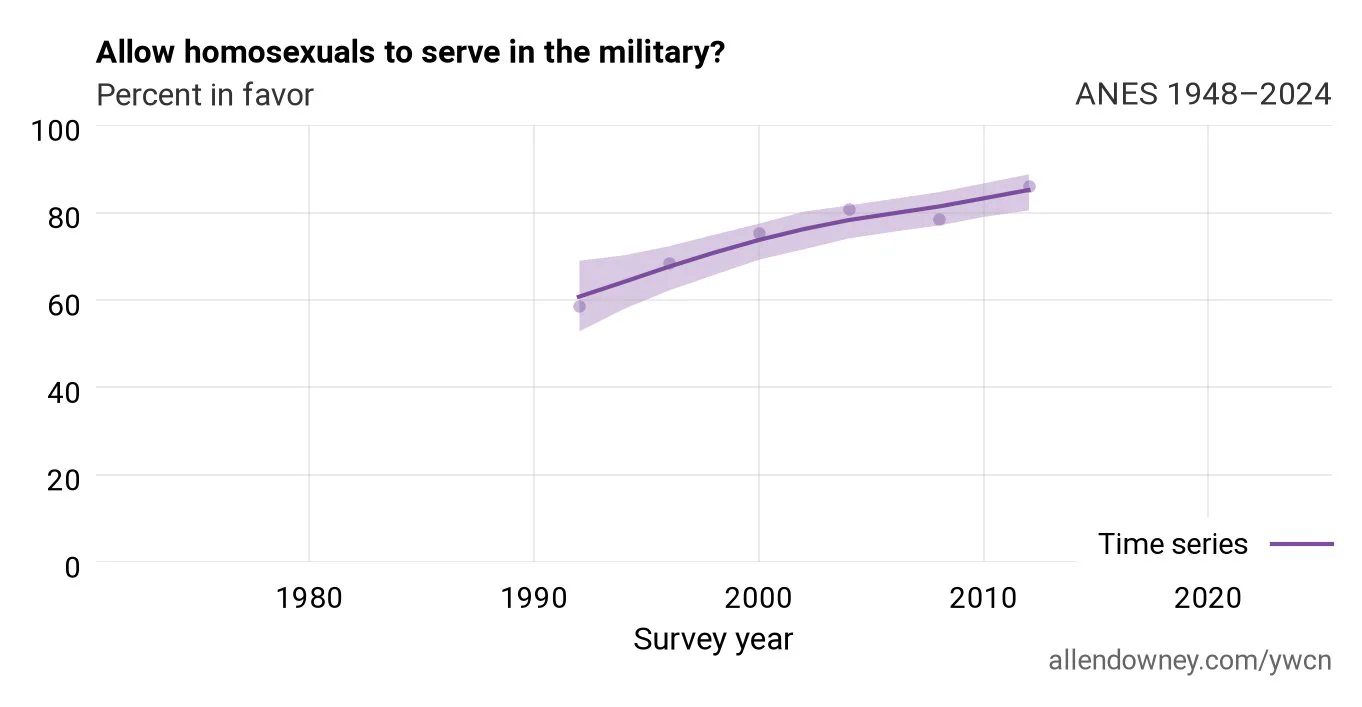
    Which comes first, public opinion or policy? That's a recurring question in my book-in-progress, You Would Choose Now. Here's an example from Chapter 2. In 1992, a majority of Americans — about 61% — said gays and lesbians should be allowed to serve in the armed forces.
    Line chart titled “Allow homosexuals to serve in the military?” Subtitle “Percent in favor,” ANES 1992–2012. Estimated support rises from roughly 61% in 1992 to about 85% by 2012, with a shaded uncertainty band around the time-series line and survey points as dots.
    1
  • @AllenDowney
    Allen Downey
    @AllenDowney
    Sep 8
    In 1988, when the American National Election Studies first asked about laws protecting gays and lesbians from job discrimination, opposition was already below 50%. But even in 2020, when opposition was below 20%, discrimination was still legal in 31 states.
    Line chart titled “Laws protecting gays from job discrimination?” Percent opposing, ANES, about 1988–2024. Estimated opposition falls from roughly 45% in the late 1980s to under 20% by the 2020s, with a shaded uncertainty band around the time-series line and survey points as dots.
    1